
McKinsey found that as much as 50% of the work we do today could be automated in the next few decades. But as our latest Work Automation Index revealed, we don’t need to wait years for automation to become widely adopted.
Through our Work Automation Index, which looked at how 900 companies used automation over a one-year period, we found that more and more teams are adopting automation, business operations teams now leverage it more than IT, finance is the most automated department—and much, much more.
We’ll take a closer look at the automation trends above, among several others, so that you can benchmark your automation activities and better determine what to automate next.

Wondering what else we found from our research?
You can read through our Work Automation Index to uncover all of our key findings.
1. Automation adoption is spreading across the business
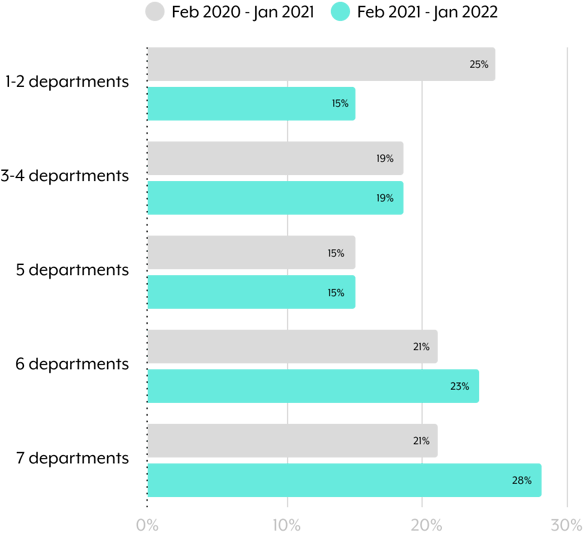
Automation is no longer confined to a single IT or engineering department—our research shows that it now touches more parts of the business than ever.
Just 15% of businesses use automation in 1 or 2 departments, down from 25% in 2020, and we expect that number to fall further as companies adopt enterprise-wide automation strategies. Moreover, 66% of businesses already use automation in at least 5 departments.
Perhaps most striking, the percentage of organizations that have at least 7 departments automating is growing at the fastest clip (33% YoY). If this growth rate remains constant, more than a third of companies will be in that top tier within the first few months of 2023.
2. The share of automations built by IT is shrinking—while business ops’ share is growing
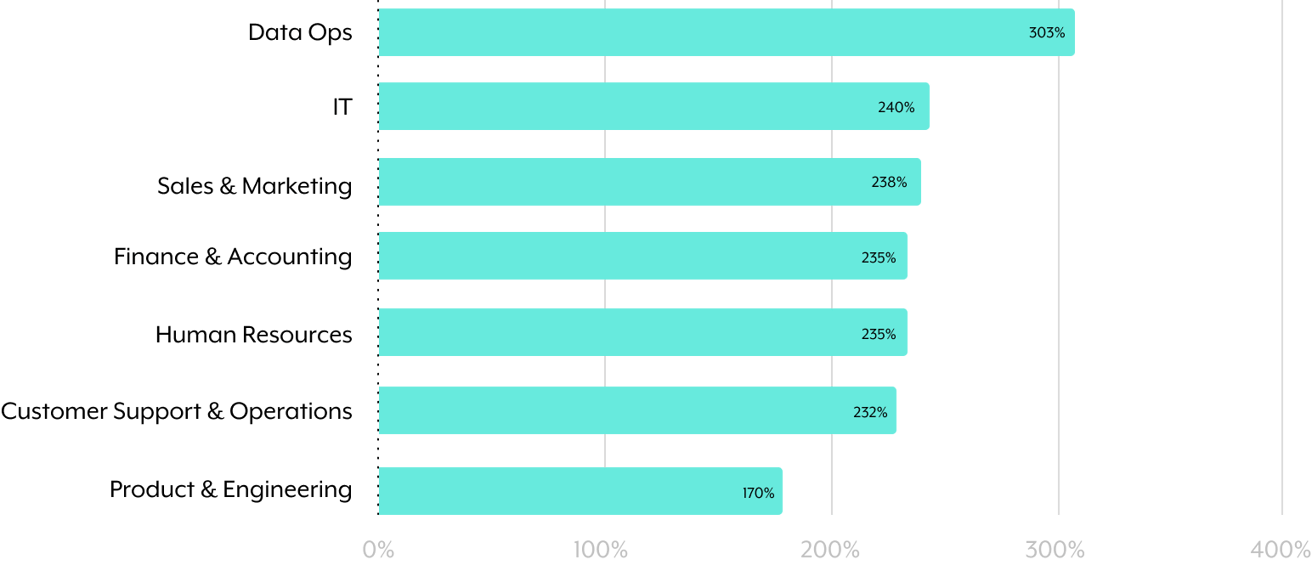
Employees who work within business ops (e.g., marketing ops, sales ops, customer ops, etc.) now build the highest share of automations (23%).
While IT still handles most automations in DataOps and finance, business ops teams now build most marketing, sales, HR, and customer service automations. Almost three-quarters of customer service automations, for example, are built by ops personnel who work inside the department.
As business ops’ roles change, so will IT’s. According to a survey by MIT Sloan, this shift is already taking place: The majority of CIOs (61%) are now “co-pilots” who directly engage with business teams on initiatives that aim to transform the business.
3. Finance is now the most automated part of the business
The most automated department is no longer IT—it’s finance.
This automation trend should perhaps come as little surprise: Finance teams perform a number of repetitive processes, and if any relies on human intervention, significant human errors can ensue.
Several critical processes are getting automated quickly, including record to report (291% YoY), procure to pay (282% YoY), and order to cash (221% YoY).
Related: The top finance automation statistics in 2023
4. DataOps teams are using automation to pave the way for big changes
Data is the foundation for digital services—and companies deal with more of it every year.
Gartner predicts that companies will hit a digital wall in 2025 when the volume of data finally overwhelms the capabilities of conventional computing methods, but many aren’t waiting around to see what happens then.
To enable artificial intelligence, machine learning, natural language processing, and other cutting-edge, compute-intensive technologies, forward-thinking DataOps teams are integrating data platforms and automating data management across disparate environments.
We’re already seeing this trend play out in our data: DataOps is building automations at a faster rate than any other department (more than 4x YoY).
5. Automation adoption is exploding in the hospitality sector
With the hospitality sector no longer crippled by travel restrictions and lockdowns, it’s had to re-adjust to a high demand for travel.
As it turns out, a key solution to their adjustment has been automation—the hospitality industry has increased its automation output by an incredible 16x YoY, more than any other industry.
Automation’s accelerated adoption in hospitality (and in other industries) shows that many now see automation as a means to cope (if not excel) in unpredictable markets.
This is further evidenced by the fact that while other departments’ budgets may have been shrinking, the business technology department’s grew by 65% last year.
6. Supply chains have fewer human touch points
The retail industry is desperately seeking new ways to make supply chains resilient to market disruptions, like the coronavirus pandemic. And because automated processes are more adaptable, reliable, efficient, and scalable (up or down)—adoption is skyrocketing.
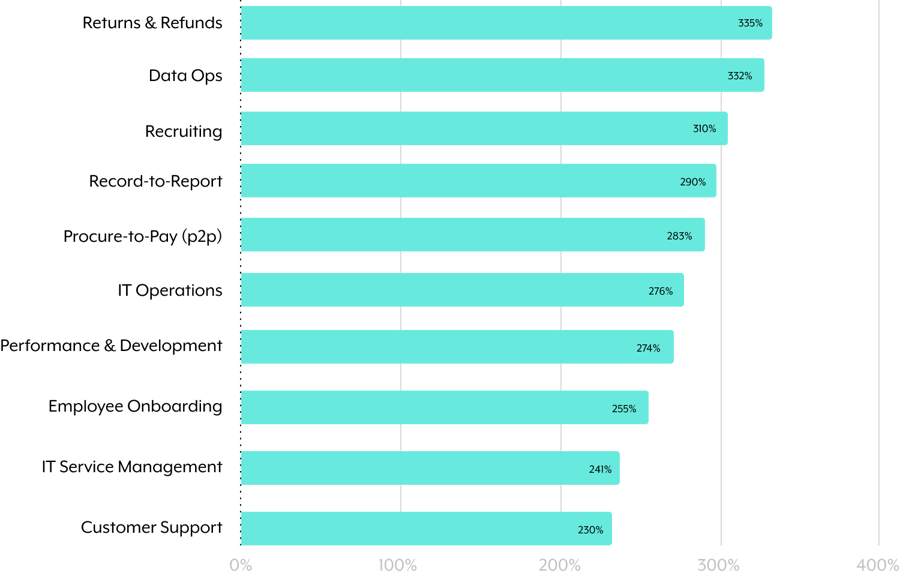
Businesses in the retail industry currently automate about 6x more processes than they did last year. And one of these processes, returns and refunds, saw 335% higher automation adoption last year—the highest increase of any process.
7. Automation is boosting HR’s productivity
HR teams are turning to automation for a wide range of their day-to-day work.
Automations for recruiting, onboarding, and offboarding make up half of all HR automations, but employee performance & development automations are increasing almost 4x YoY—an indicator that productivity is also a departmental priority.
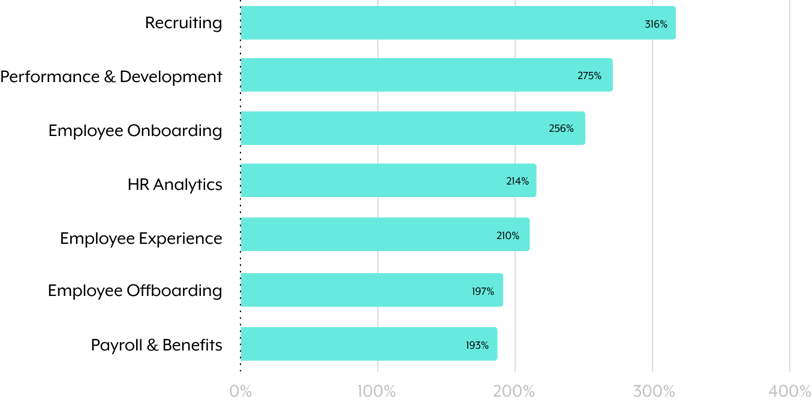
YoY automated process growth in HR
Related: The most insightful HR automation statistics from our Work Automation Index
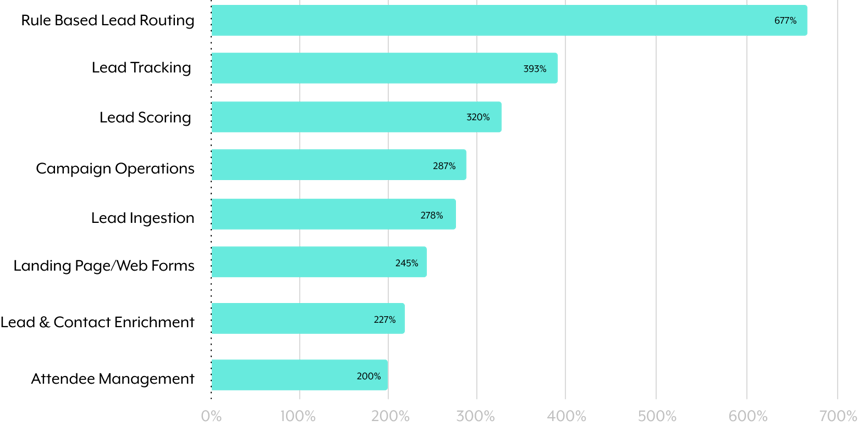
8. Sales and marketing teams are embracing hands-off lead management
Gartner found that while marketing budgets are trending upwards, they still aren’t where they were pre-pandemic. Marketing leaders have had to get creative with smaller budgets, and freeing up the 13 hours they spend on operational tasks every week is a big part of that.
Lead routing, tracking, and scoring now top the list of the most automated marketing processes. Add lead ingestion and qualification, and you have a fully automated lead management system that funnels leads through marketing and sales with little friction.
This is the future of lead management and, for an increasing number of companies, the present. The adoption of automated, rule-based lead routing, for example, increased nearly 8x last year.
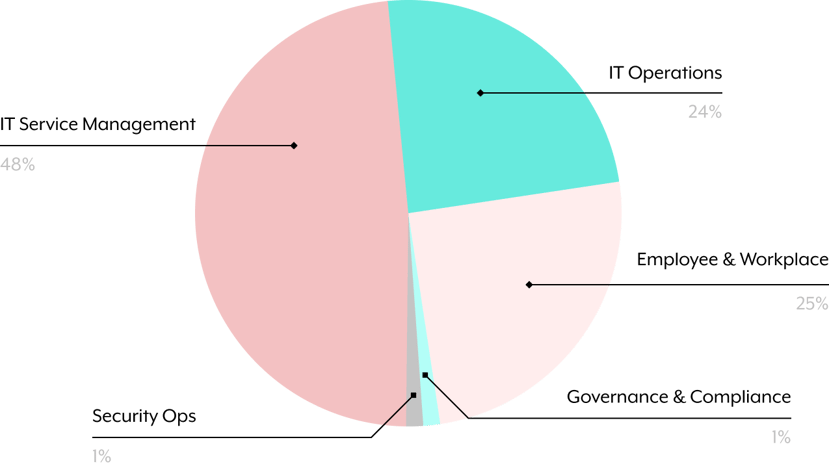
9. Automated IT service management is helping IT manage their growing workload
As business moved online and employees began working remotely during the early months of the pandemic, the volume of IT tickets began skyrocketing.
To help IT cope, they’ve doubled down on IT service management (ITSM) automations. These automations account for nearly half of all IT automations and grew by 235% YoY.
10. Demand for automation is growing exponentially across regions
Our research uncovered growing automation adoption in the Asia Pacific and Japan (APJ) as well as in Europe, the Middle East, and Africa (EMEA).
Similar to the Americas, financial automations are being adopted at the fastest rate—record to report, for example, is increasing 6x and 4x annually in APJ and EMEA, respectively.
One of the top regional trends includes an 11x jump in automated returns and refunds in APJ this year. The trend appears set to continue as Euromonitor International, a global market research firm, predicts that the e-commerce industry in Asia will double by 2025.