The pandemic has pushed customer support teams to rethink how they interact with and provide value to customers. And automation, as it turns out, is the vehicle that’s driving their innovative solutions.
When analyzing the automations that 900 midsize and enterprise organizations implemented on our platform last year, we found that the number of customer support automations built has increased by leaps and bounds. Automations for processes that fall within an organization’s service desk, as an example, have more than tripled YoY.
So, what exactly are support teams focused on automating? And how are they implementing these automations? We’ll share several automation statistics that answer these questions, among others you might have.

Uncover all of the key findings from our analysis
Discover the top automation trends taking place across sales, HR, marketing, and IT departments by reading our Work Automation Index.
Automations for processing returns and refunds have increased by 338%
To improve our analysis, we created 3 categories for customer support automations:
- Returns and refunds
- Customer support, which encompasses service desk processes like support requests, incident escalations, and chatbot interactions
- Customer operations, which includes customer surveys, customer onboarding and training, and the handoff from sales to customer success
While all 3 categories experienced significant growth YoY, returns and refunds clearly came out on top.
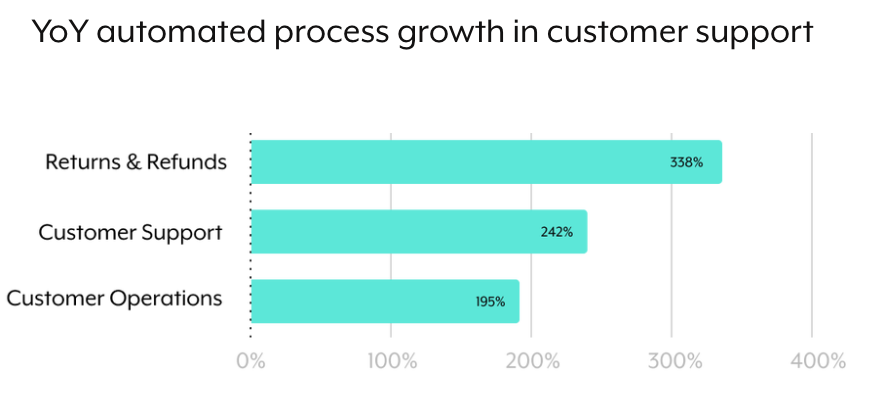
The reasons for its unrivaled spike are difficult to confirm, but the recent growth in online sales have likely motivated organizations to implement more scalable and efficient workflows around this process.
72% of support automations are built by employees who work in the department
If you want to understand how support teams have been able to scale the volume of their automations, you won’t need to look any further than this support automation statistic.
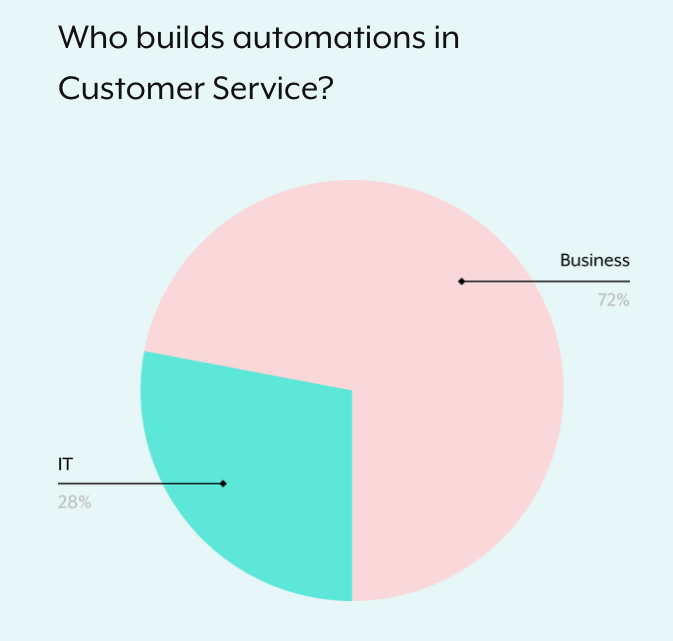
Now that many employees who work in a support operations capacity (among other support roles) feel comfortable in building integrations and automations, the department won’t have to deal with the delivery bottlenecks that come with relying on IT or engineering. All the while, IT can focus more on enabling these builders by providing general best practices, automation templates, in-person training, etc.; moreover, IT can still manage the governance and security controls for any automation that’s built, ensuring each gets implemented safely.
The situation is a clear win-win: Customer support can build impactful automations quickly and without compromising the business, while IT can focus on other business-critical work that demands their attention.
Related: How to establish an automation center of excellence
Nearly two thirds of automations center around an organization’s service desk
Perhaps unsurprisingly, processes that are classified under customer support still earn the lion’s share of automations.
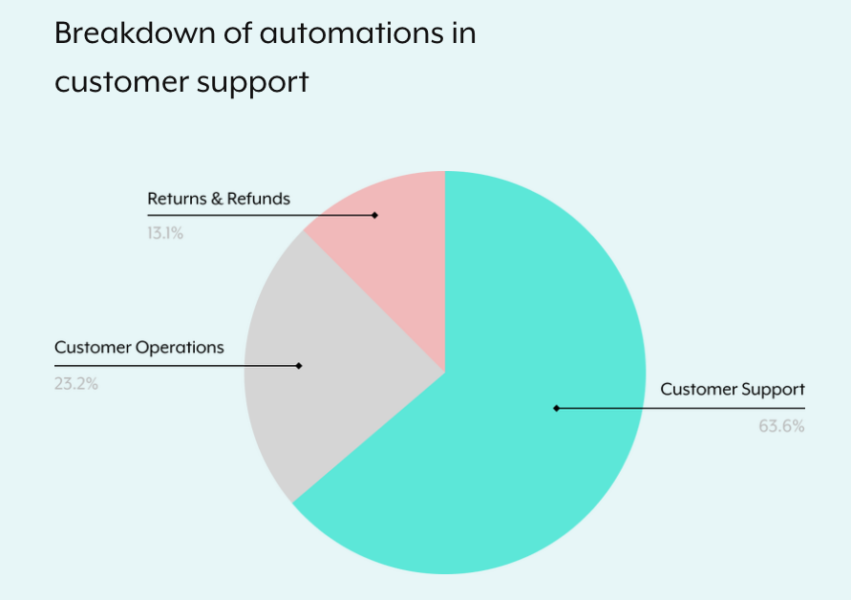
These automations can benefit the customer experience and your support team in a number of ways. Automating requests and escalations, for example, allows your team to address business-critical issues faster (thereby minimizing their associated costs); while using chatbots to respond to clients enables you to offer a best-in-class customer experience and frees up time for your support agents—empowering them to focus on other areas that deserve their attention.
Salesforce is used in more than half of all support automations
The CRM platform is clearly popular among support teams, but its popularity varies based on the category of support automation you look at. For example, Salesforce is used in 67% of automations that fall under customer operations, but it’s only used in 30% of automations that fall under returns and refunds.
Other applications are also often used in specific automation categories. For instance, Jira is used in 33% of automations that fall under customer support, while NetSuite is used in 28% of automations that fall under returns and refunds.
Support automations make up less than 10% of an organization’s share of automations
Despite the aggressive growth in automating support processes, the share of automations built in support versus other functions is fairly small, standing at only 8%.
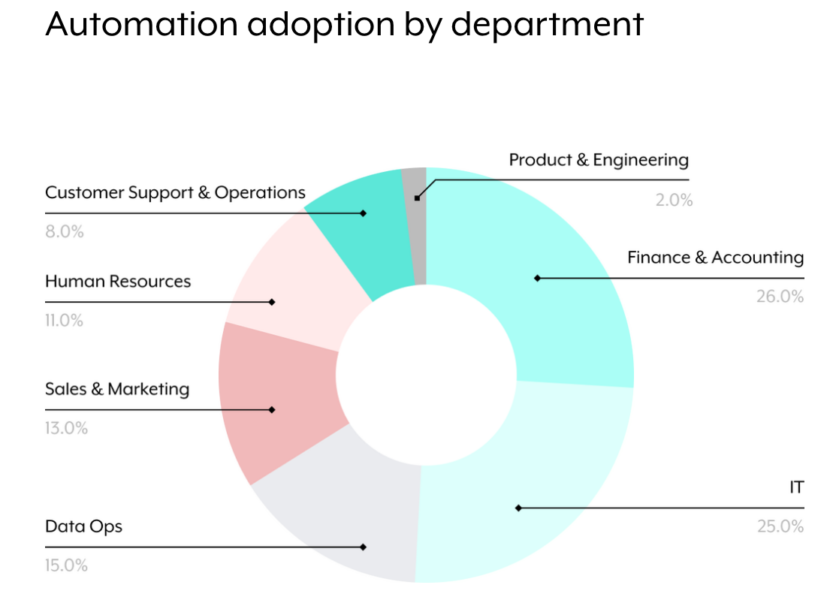
This doesn’t mean that support automations are any less important than the automations built in other functions. There just also happens to be many automation use cases in other departments, and, as our Work Automation Index revealed, these functions are increasing the volume of automations they build by leaps and bounds as well.
