As HR teams look to deliver better experiences for candidates and employees, they have a variety of levers to choose from—and automation, as it turns out, is becoming an increasingly popular one to pull.
When analyzing the automations that 900 midsize and enterprise organizations built on our platform from February, 2021 through January, 2022, we found that HR teams are increasing the number of automations they bring to market by leaps and bounds. Moreover, these automations span various areas, including talent acquisition, onboarding, and payroll.
We’ll cover this department-wide trend further by sharing the most powerful HR automation statistics from our analysis.
High-level HR automation statistics
Let’s start by covering statistics that focus less on specific processes and more on HR as a whole.
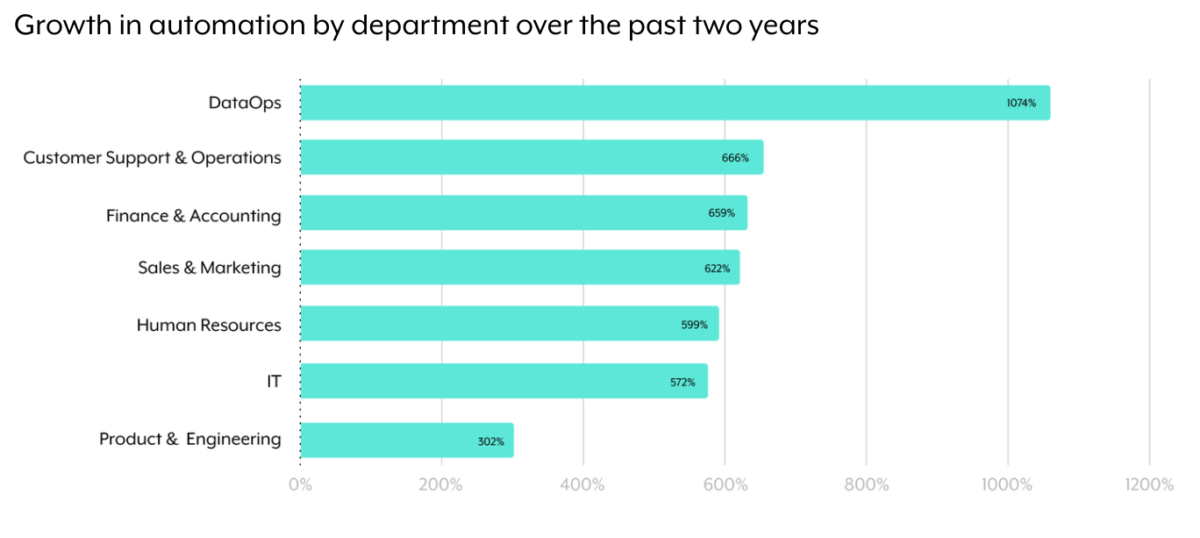
- HR automations have risen by 235% in just a year. This growth rate is tied for 4th among all the departments we measured.

- HR automations have risen by 599% over the past two years.
- HR automations make up 11% of the total automations built at an organization.

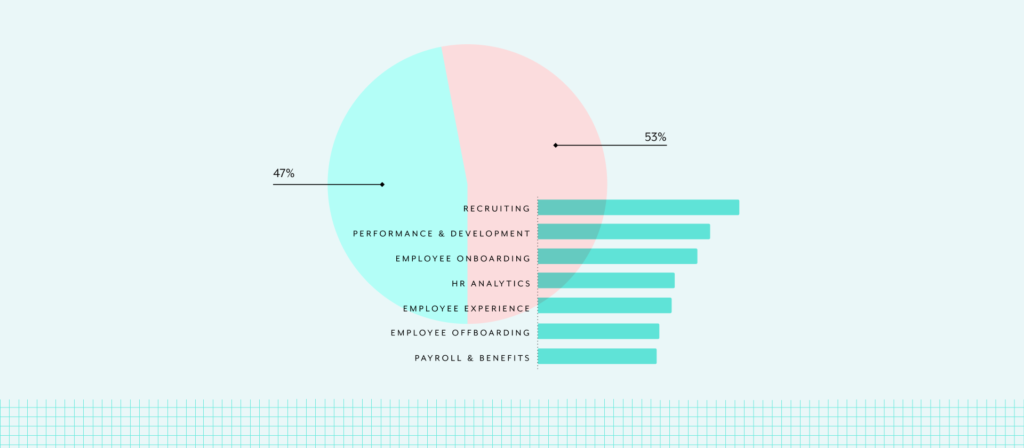
- More than half of those building HR automations (53%) work in a business role, such as HR operations.

Recruiting automation statistics
Recruiting automations play a crucial role in providing a best-in-class experience for candidates, hiring managers, and recruiters. They allow candidates to receive accurate offer letters quickly; they ensure that interviewers come into interviews feeling prepared; they enable recruiters to avoid manual, time-consuming tasks—and the list goes on.
Given these benefits, the following recruitment automation stats should come as little surprise.
- Recruiting automations have risen in adoption by 316% year-over-year (YoY).

- Slack is the most frequently used application for recruiting automations, appearing in 24% of them.
- Automated offer letter creation is the most popular use case, owning a 33% share of all recruitment automations.
- Interview scheduling saw the biggest rise—YoY—of any recruitment automation, at 1,000%.
Employee onboarding automation statistics
Onboarding automations can serve a variety of purposes. They allow new hires to receive the applications and equipment they need by the beginning of their first day; they help new hires meet and connect with their team members; they provide new hires with company swag, and much, much more.
- Onboarding automations make up 20% of all HR automations.

- Okta is used in 14% of employee onboarding automations—making it the most widely-used application for this use case.
- Automations around scheduling orientations saw the biggest rise YoY, at 900%.
- Identity and access provisioning-based automations own the highest share of onboarding automations, at 50%.
Related: 18 automation statistics that show how organizations are transforming their operations
Employee experience automation statistics
Even after you manage to recruit and onboard employees successfully, you’ll need to provide them with day-to-day experiences that exceed their expectations and that allow them to thrive. Otherwise, you risk losing them to another employer or, just as bad, increase the chances that they disengage from their job.
Various examples underscore the role HR automation plays in delighting employees and in inspiring them to produce their best work. In addition, the statistics below show that HR teams see the value in leveraging customizable chatbots that employees can access in the application they are already using: their business communications platform (e.g. Slack).
- HR bots that can streamline a wide range of requests and approvals (e.g. PTO) are the most common automation use case for managing the employee experience; they’re included in 39% of employee experience automations.
- Health and wellness-related bots have seen the highest spike in automation adoption YoY, at 360%.
- Salesforce is the most frequently-used application for employee experience-type automations, and is used in 18% of them.
Payroll and benefits automation statistics
Your employees expect to get paid on time and in full. Anything less and your employees will grow frustrated and disengaged, no matter the rest of their experience at your company. Automation can help ensure that employees receive their deserved benefits and compensation on time, as well as allow HR teams to process and administer both more easily.
- Automations around direct compensation are most popular, making up 47% of all payroll and benefits automations.
- Payroll processing has risen the most in automation adoption, growing by 3,700% YoY.
- Salesforce is the most popular application for payroll and benefits automations; it’s included in 12% of automations that fall within this category.
These insights only scratch the surface of what we found in our analysis. To see how teams in sales, finance, marketing, support, and IT are automating, you can read through our Work Automation Index.