
The pandemic has had a profound impact on the way organizations approach and implement their automations.
Priorities have shifted. Specific automations have surged. And individual teams have gone on to more fully embrace automation relative to their peers.
How do we know?
We compared the automations that roughly 700 of our clients (which we anonymized) implemented over two time periods: April, 2019—March, 2020 and April, 2020—March, 2021. We also went on to look at the job titles of the employees who were involved in building the automations, allowing us to assess IT’s level of involvement versus lines of business.
Finally, after analyzing our findings, we organized and packaged them up as part of our first-ever “W*rk Automation Index.”
We’ll give you a taste of the insights presented throughout the research report below, but to access our full set of findings, you can read through our W*rk Automation Index here.
More and more departments are automating
The pandemic has forced teams to change how they operate, with the focus being placed online now more than ever.
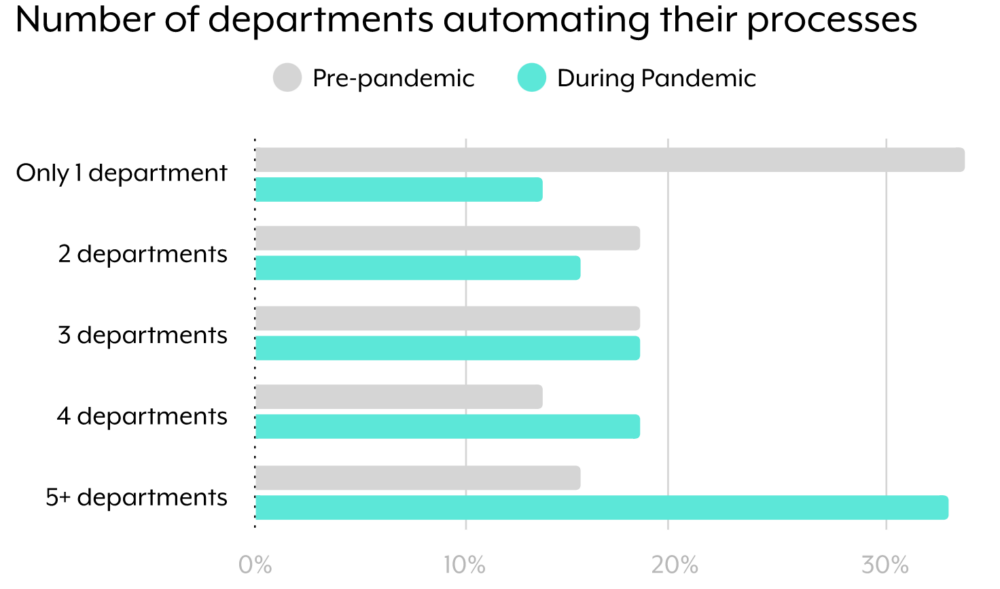
In addition, teams want their key processes to be scalable, error-free, and delight key stakeholders—whether that’s clients, colleagues, or candidates. As a result, we’ve seen the number of teams that are automating their workflows increase exponentially.
Pre-pandemic, we typically just saw 1 department automate their processes, but today we’re significantly more likely to see 5 or more departments automate their workflows.
Customer support teams have invested in automation the most
Given the business uncertainty brought on by the pandemic, the need to retain clients has never been more pressing.
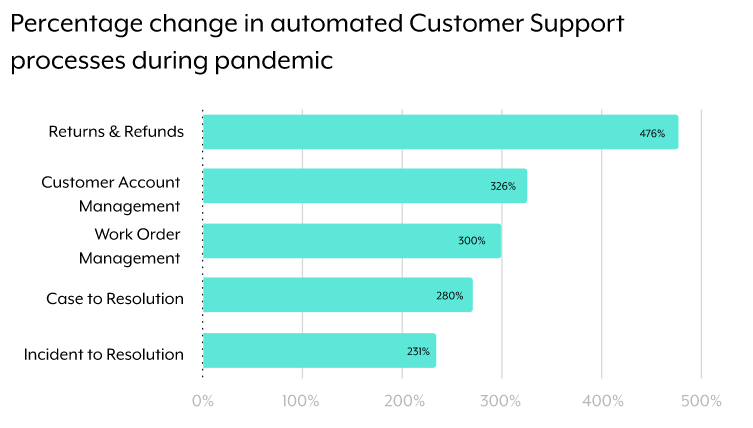
Perhaps it’s little surprise then that customer support teams have turned to automation more than other functions—with the aim of keeping clients satisfied.

Which support workflows are leading this 290% surge? It’s largely driven by returns and refunds, customer account management, and work order management.
The responsibility of implementing automations is increasingly distributed
Gone are the days of relying on a few employees in IT to build automations.
Employees across lines of business want their automations implemented quickly, and with our low-code platform, this want has become a reality.
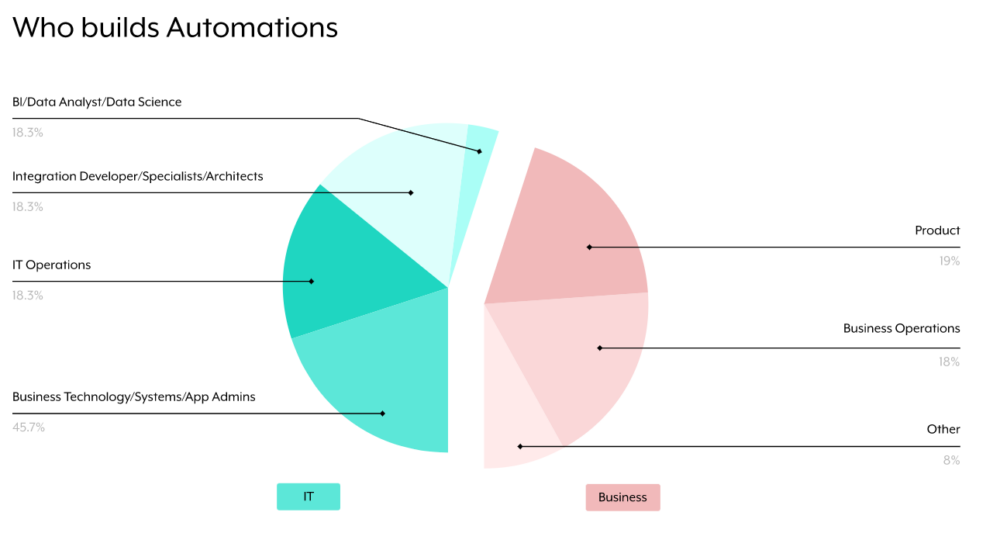
While various teams within IT still play a significant role, we’re also seeing product teams (19%) and business operations teams (18%), which include sales ops, marketing ops, and financial ops, get involved in the process.
These findings only cover a sliver of our W*rk Automation Index. To really understand how the automation landscape has shifted during the pandemic, you can check out the full report.