
Data-driven decision-making has become the foundation of modern business success. Organizations across industries are increasingly turning to analytics and BI (business intelligence) to extract insights from data, optimize operations, and gain a competitive advantage.
However, many business leaders still have the same questions floating across their minds: What’s the difference between analytics and business intelligence? How do they complement one another? And which one should my company prioritize?
While business intelligence (BI) and business analytics (BA) are often used interchangeably, they serve distinct purposes and bring unique value to organizations.
To make the most of each, business leaders, operations managers, IT decision-makers, and other professionals must understand the differences between analytics and BI, areas where they overlap, and how they complement each other to maximize the value of their data.
By understanding how business intelligence and business analytics work together, leaders can choose the right tools and strategies and unlock the most value from the technologies.
If you’re looking to learn about the differences between business analytics and business intelligence, you’re in the right place. This guide covers the definitions, key components, use cases, and popular BI and analytics tools to answer those questions.
We’ll also cover how both technologies work together — and how platforms like Workato empower companies to maximize their investments in each and supercharge their business with real-time, unified insights.

What is business intelligence?
Business intelligence (BI) refers to the technologies, strategies, and practices that help organizations collect, integrate, analyze, and present historical and current business data.
Its primary goal is to provide decision-makers with a clear and accurate view of what’s happening in the organization now and what occurred in the past, which enables them to make smarter decisions about the future.
At a high level, BI focuses on descriptive and diagnostic analysis. It helps answer questions like:
- What happened?
- Why did it happen?
- What’s happening now?
Key components of business intelligence
Business Intelligence is made up of several core components that work together to transform raw data into actionable insights. These elements form the foundation of any effective BI system and ensure that decision-makers have access to accurate, timely, and meaningful information.
Data warehousing
A core component of BI is a data warehouse, a centralized repository that consolidates data from various sources. It’s designed primarily for structured data, such as transactional records, CRM entries, and ERP data, though some modern solutions can also handle semi-structured data. By organizing data consistently, data warehouses enable reliable reporting and analysis across the organization.
With a proper data warehouse in place, all departments can work from a single source of truth, minimizing discrepancies and errors.
Data integration
BI requires aggregating and consolidating data from multiple sources to create a unified dataset. Effective data integration ensures consistency and accuracy in reporting, which is essential for making reliable business decisions.
ETL processes
Extract, transform, load (ETL) pipelines prepare raw data before it enters BI systems, extracting information from different sources, transforming it into standardized formats, and loading it into data warehouses. This process ensures data is clean, consistent, and ready for dashboards, reports, and queries.
Reporting tools
BI tools generate reports that summarize performance metrics. These reports range from simple tables to interactive dashboards that provide a visual representation of key performance indicators (KPIs).
Reporting tools allow business leaders to track key operational metrics, such as sales performance, revenue, and customer engagement. This enables faster, more informed decision-making — and helps ensure business goals are met.
OLAP tools
Online analytical processing (OLAP) tools enable users to analyze data from multiple dimensions, revealing patterns that might be hard to spot in traditional reports. For example, a retail company could analyze sales data by region, time period, or product category.
Ad hoc queries
BI tools enable users to run queries against data warehouses to answer specific business questions quickly. A finance manager, for example, might generate a report on quarterly revenue by product line to identify underperforming products.
Data visualization
Visual representation of data is crucial for comprehension and communication. BI dashboards utilize graphs, charts, heat maps, and other visualizations to simplify complex datasets. These visuals help you quickly identify patterns, spot anomalies, and share insights with stakeholders more effectively.
Examples of business intelligence
Business intelligence can be applied across multiple areas of an organization, transforming raw data into actionable insights that drive better performance and decision-making. Here are some common examples of how today’s leading organizations use BI:
- Sales performance dashboards track revenue, leads, and conversion rates across regions or product lines.
- Financial reporting systems monitor budgets, expenses, and profitability to make strategic decisions.
- Customer insights reports analyze customer segmentation, purchase behavior, and retention rates to enhance marketing strategies.
- Operational efficiency dashboards monitor supply chain performance, production output, and employee productivity.
- HR analytics dashboards evaluate workforce trends, such as hiring, turnover, and employee satisfaction, to optimize talent management.
BI is especially useful for organizations looking to maintain operational efficiency, monitor KPIs, and respond quickly to performance issues. It provides a retrospective view of operations that can guide both tactical and strategic decision-making.
What is data analytics?
Data analytics is a broader field that involves examining raw data to extract meaningful insights, uncover patterns, and predict future outcomes. While business intelligence focuses on descriptive reporting, data analytics goes further by explaining why events happen and what’s likely to occur next.
Analytics typically answers questions such as:
- Why did this happen?
- What will happen next?
- What actions should we take to improve outcomes?
To achieve this, data analytics uses statistical methods, machine learning, and algorithmic modeling to turn raw data into actionable insights. It’s both diagnostic (e.g., explaining causes), predictive (e.g., forecasting trends), and — in advanced cases — prescriptive (e.g., recommending actions to optimize results).
Types of analytics used in BI
Data analytics can be categorized into four main subtypes, each of which serves a different purpose when it comes to turning raw data into actionable insights.
1. Descriptive analytics
Descriptive analytics provides a detailed summary of historical data, enhancing BI with segmentation and exploratory analysis. It answers the question: “What happened?”
2. Diagnostic analytics
Diagnostic analytics focuses on root-cause analysis, using methods such as cohort analysis, hypothesis testing, and correlation studies to answer the question: “Why did it happen?”
3. Predictive analytics
Predictive analytics uses machine learning and statistical models to forecast future outcomes — like predicting customer churn, fraud risk, or customer lifetime value. It answers the question: “What’s likely to happen?”
4. Prescriptive analytics
Prescriptive analytics recommends specific actions and optimizations, such as price adjustments or next-best-action strategies. It addresses the question: “What should we do about it?”
Key components of data analytics
Data analytics is built with several key components that work together to transform raw information into meaningful insights. Each step ensures data is accurate, usable, and ready to support predictive and prescriptive decisions.
By understanding each of these components, you gain a clearer picture of how analytics delivers real business value.
Data collection and cleansing
The analytics process starts with gathering data from multiple structured and unstructured sources, such as CRMs, social media platforms, and IoT devices. Once collected, the data must be cleaned and standardized to remove errors and fill gaps.
This ensures accuracy, consistency, and usability.
Exploratory data analysis (EDA)
EDA uses statistical techniques and visual exploration to uncover relationships, patterns, and anomalies within datasets. This stage helps analysts understand the data better before applying advanced modeling techniques.
Predictive analytics
Predictive analytics uses machine learning algorithms and statistical models to forecast future outcomes — like projecting sales performance, customer churn, or demand fluctuations.
Prescriptive analytics
Building on predictive insights, prescriptive analytics recommends optimal actions based on data. Examples include suggesting the best product pricing strategy and determining the most effective marketing campaign to run.
Big data processing
For organizations handling massive or real-time datasets, big data technologies such as Apache Spark and Hadoop provide the performance needed for analytics at scale. These tools make it possible to analyze data at a speed and scale that traditional systems cannot match.
Examples of data analytics
Data analytics can be applied across industries to solve real business challenges. Here are some practical ways you can use it in your organization:
- Churn prediction. You can use data analytics to identify which customers are at risk of leaving based on historical behavior, engagement, and purchase patterns.
- Fraud detection. Real-time data analytics can help you detect unusual patterns in transactions, mitigating financial losses.
- Demand forecasting. Using analytics, you predict inventory needs and supply chain requirements based on seasonality, historical sales, and market trends.
- Marketing optimization. Data analytics can analyze campaign performance to allocate budgets effectively and improve ROI.
- Product development insights. You can use analytics to determine which product features are most likely to succeed in the market.
Data analytics provides actionable insights, not just reports. It identifies trends, anomalies, and predictive signals to help organizations move from reactive to proactive decision-making.
What is business analytics (BA)?
Business analytics (BA) is a specialized branch of data analytics that focuses on solving business problems and improving decision-making. It combines quantitative analysis, statistical modeling, and data-driven insights with business strategy to deliver targeted solutions.
While business intelligence highlights the current state and historical performance, BA goes further by uncovering root causes, forecasting future outcomes, and guiding strategic decisions.
It involves descriptive, diagnostic, predictive, and prescriptive analytics, often tailored to the unique challenges of a specific organization or industry.
Business analytics often seeks to answer these questions:
- Why did a certain trend occur?
- What will likely happen if current patterns continue?
- What actions should we take to optimize outcomes?
For example, business analytics in retail might analyze customer purchase behavior to recommend optimal product bundles. In banking, it might predict credit risk to reduce default rates.
In either case, business analytics links data analysis with strategic decision-making. In other words, BA helps organizations maximize the value of their data.
Key components of business analytics
Business analytics delivers the most value when it balances technical rigor with practical business application. To transform raw data into actionable strategies, BA typically involves these key components.
Statistical analysis and modeling
BA relies on advanced statistical techniques to uncover patterns and relationships between variables. For instance, a company might study how different pricing strategies affect customer demand across regions.
Predictive modeling
Using historical data, predictive models help organizations anticipate future trends and outcomes. These models can be applied to forecast sales, assess risks, or evaluate the potential impact of launching a new product line.
Prescriptive analytics
Prescriptive analytics builds on predictive insights by recommending specific actions. For example, a financial services firm might use prescriptive models to decide how to reallocate capital to minimize risk exposure.
Business process integration
The true value of BA comes from embedding insights directly into business workflows. When companies integrate analytics into processes such as supply chain management, marketing campaigns, or financial planning, they ensure that data consistently informs decisions.
What is the difference between business intelligence and business analytics?
Though the terms are often used interchangeably, business intelligence and business analytics serve different but complementary roles. BI focuses on describing what has already happened and what is currently happening while BA aims to explain why events occur, predict future outcomes, and recommend strategies for improvement.
When you understand these distinctions, you can select the tools and strategies that best fit your organization. Here’s a closer look at how BI and BA stack up.
| Business Intelligence | Business Analytics | |
| Focus | Past and present performance | Future outcomes and strategy |
| Primary questions | What happened and why? | What will happen and what should we do? |
| Techniques used | Dashboards, reporting, data visualization | Predictive modeling, machine learning, statistical analysis |
| Data sources | Structured, historical data (e.g., warehouses, ERPs, CRMs) | Structured and unstructured data (e.g., social media, IoT, big data platforms) |
| Use cases | Monitoring KPIs, generating operational reports | Forecasting demand, optimizing pricing, and customer segmentation |
| Time horizon | Descriptive and diagnostic | Predictive and prescriptive |
The key difference between BI and BA is that the former explains what happened and where attention is needed while the latter predicts what will happen and how you should act.
Business intelligence vs. business analytics: How they work together
Rather than viewing BI and analytics as competing approaches, it’s more effective to see them as complementary layers of a complete data strategy. Here’s how:
- BI provides context. Dashboards and reports establish what the current lay of the land is by showing what’s already happened.
- Analytics provides foresight. Advanced techniques build on that foundation to anticipate future scenarios and recommend optimal decisions.
For example, a financial institution may use BI dashboards to monitor loan approval rates by branch. Analytics can then take that same data, combine it with macroeconomic indicators, and forecast default risks.
Together, BI and analytics create a closed feedback loop:
- BI identifies a problem or trend.
- Analytics determines the root cause and predicts future outcomes.
- The organization acts on the insight.
- BI measures whether the corrective actions worked.
A typical enterprise workflow
To see how this plays out in practice, here’s a step-by-step example of how BI and analytics can be orchestrated within an enterprise:
Step 1: Ingest & consolidate (BI)
Start by gathering data from core banking, Know Your Customer (KYC) systems, customer relationships management (CRM) records, payments, and logs into a centralized data warehouse.
Step 2: Create trusted views (BI)
Next, build standardized tables and dashboards to become the canonical source for downstream analysis.
Step 3: Explore & hypothesize (analytics)
Once you have a single source of truth, your data scientists can now run exploratory analysis to discover patterns or anomalies (e.g., a spike in chargebacks).
Step 4: Model & validate (analytics)
After that, build and validate predictive or causal models with proper test/validation splits, monitoring for drift.
Step 5: Operationalize (analytics + integrations)
Once validated, you can output scores or recommendations and feed them back into operational systems — such as fraud engines, customer support queues, or onboarding flows — so that actions happen automatically.
Step 6: Monitor & iterate (BI + analytics)
Finally, use dashboards to track model performance and business KPIs. Also, your analytics teams will continue to refine models based on production data, leading to incrementally better outcomes.
Benefits of business intelligence and analytics
Investing in both business intelligence and business analytics delivers measurable business value. BI strengthens operational oversight and reporting while analytics provides foresight and strategic direction.
Together, they give organizations a 360-degree view of performance, risks, and opportunities.
Benefits of business intelligence
- Operational efficiency. BI helps you quickly identify performance bottlenecks and improve workflows.
- Data-driven decision-making. It also enables executives to make informed, evidence-based decisions.
- Real-time monitoring. BI enables you to track key metrics and KPIs across departments.
- Improved reporting. It also helps you generate accurate and standardized reports for internal and external stakeholders.

Benefits of business analytics
- Predictive insights. Business analytics helps you anticipate trends, shifts in customer behavior, and market changes.
- Risk mitigation. It also enables you to identify risks before they escalate, such as fraud or operational inefficiencies.
- Strategic optimization. Using analytics, you can determine the most effective actions for business growth and profitability.
- Innovation enablement. You can also leverage data to explore new opportunities, products, or markets.
When organizations combine BI and analytics, they gain both a clear view of past performance and a reliable forecast of future potential. This integrated approach improves planning, risk management, and resource allocation across the enterprise — leading to better business outcomes.
Applying BI and BA in the real world: Use cases
Business intelligence and business analytics are not abstract concepts. They deliver measurable impact across industries.
BI gives organizations operational visibility while BA provides predictive foresight and optimization. Together, they enable businesses to move from simply monitoring performance to actively improving it.
With that in mind, let’s examine some popular BI and BA use cases.
Financial services
- Business intelligence: Track daily cash flow, monitor KYC completion rates, and ensure service-level agreement (SLA) compliance to maintain operational stability.
- Business analytics: Model credit risk and forecast potential defaults. When combined with orchestration tools, analytics can trigger automated alerts or verification steps, reducing financial exposure and improving compliance.
Healthcare
- Business intelligence. Monitor critical metrics such as bed occupancy, readmission rates, and laboratory turnaround times to maintain service quality.
- Business analytics. Predict patient admission trends and optimize staffing schedules, enabling hospitals to balance resources, lower costs, and improve patient care outcomes.
Retail & ecommerce
- Business intelligence. Provide visibility into product sales performance, customer purchasing trends, and current stock levels.
- Business analytics. Forecast demand spikes, recommend restocking strategies, and even personalize offers to customers, helping retailers prevent stockouts and maximize revenue opportunities.
Manufacturing
- Business intelligence. Track production throughput, machine utilization, and yield rates to ensure operational consistency.
- Business analytics. Use predictive maintenance models to detect early signs of equipment failure, reduce costly downtime, and extend the life of critical assets.
Each example demonstrates how BI provides the baseline visibility and analytics that drive optimization and automation.
Tools & technologies for BI and business analytics
To fully unlock the value of business intelligence and business analytics, organizations need more than just skilled people. They need a robust ecosystem of tools and platforms.
These technologies work together to collect, clean, process, analyze, and operationalize data, ensuring that insights are both accurate and actionable.
As you take the next step in your journey to becoming a truly data-driven organization, here are some BI and BA tools to consider.
BI tools
Tools like Power BI, Tableau, Qlik, and Looker are designed for business users who need quick insights and easy-to-use reporting. They provide dashboards, self-service reporting, and data exploration. BI tools are best for visual exploration, executive dashboards, and self-service analytics for business users.
BA tools
Next are platforms and languages that enable more advanced modeling, statistical analysis, and predictive capabilities:
- Python, R, and SAS with libraries (Pandas, Scikit-learn, TensorFlow) are tools for flexible model development, statistical analysis, and building custom algorithms.
- Spark, Databricks, and BigQuery provide scalable computation for large datasets and complex queries.
- MLOps platforms (e.g., MLflow and Kubeflow) streamline the machine learning lifecycle, including model training, versioning, deployment, and monitoring.
Data infrastructure tools
Strong infrastructure ensures that BI and analytics tools work on reliable, well-structured data:
- Data warehouses and lakes — tools like Snowflake, Redshift, Google BigQuery, Azure Synapse, provide centralized storage and fast querying for large volumes of data.
- ETL/ELT tools, like dbt, Talend, or custom pipelines enable reliable ingestion, transformation, and enrichment of data before it’s analyzed.
Integration & automation tools
Unlocking the full potential of BI and BA tools is only possible when organizations connect systems and ensure real-time insights translate into actions.
This is where Workato enters the equation, providing universal connectivity that links core systems (e.g., banking platforms, KYC, CRM, and fraud tools). It also enables real-time data flow and event-driven automation — all of which are critical for turning insights into immediate actions.
Pro tip: When selecting tools, prioritize a data architecture that ensures accuracy, accessibility, and speed. This will ensure that BI dashboards and analytics models operate on the same trusted data.
Where to invest: BI or BA?
One of the most common questions business leaders face is whether to invest in business intelligence or business analytics first. The right choice depends largely on your organization’s data maturity, business objectives, and readiness to act on insights.
Start with BI: Build a reliable foundation
If your organization struggles with fragmented data, inconsistent reporting, or a lack of visibility into operations, BI should be your first priority. BI provides:
- Standardized reporting and KPIs so all teams operate from a “single version of the truth.”
- Operational oversight through dashboards and monitoring.
- Immediate improvements in efficiency by identifying bottlenecks and trends in day-to-day performance.
Move into Analytics: Drive strategy and foresight
Once a solid BI foundation is in place, the next step is analytics. BA allows organizations to move beyond “what happened” to uncover “why it happened” and “what could happen next.” With analytics, businesses can:
- Predict customer behavior, market changes, and risks.
- Model scenarios and optimize decisions for growth, profitability, or efficiency.
- Enable proactive strategies instead of reactive responses.
Combine both: Maximize value
The greatest impact comes when BI and BA work in tandem. Together, they deliver:
- Visibility and foresight. BI offers clarity on past and present performance while BA projects future outcomes.
- Better planning and allocation. Resources, budgets, and people can be optimized with both hindsight and foresight.
- Increased competitiveness. By learning from history while preparing for future challenges, businesses stay agile and are more likely to make the smartest decisions.
Quick decision checklist
Ready to get started with BI and BA? Use the following checklist to guide your investment decision:
- Do you lack a single version of the truth? → Start with BI and data integration.
- Are your stakeholders asking “what happened?” more often than “why?” → Prioritize dashboards and governance.
- Do you already have clean, reliable data and want to be proactive? → Add analytics and predictive modeling.
- Do you want to automate actions based on insights? → Invest in integration and automation platforms (e.g., Workato) to operationalize analytics.
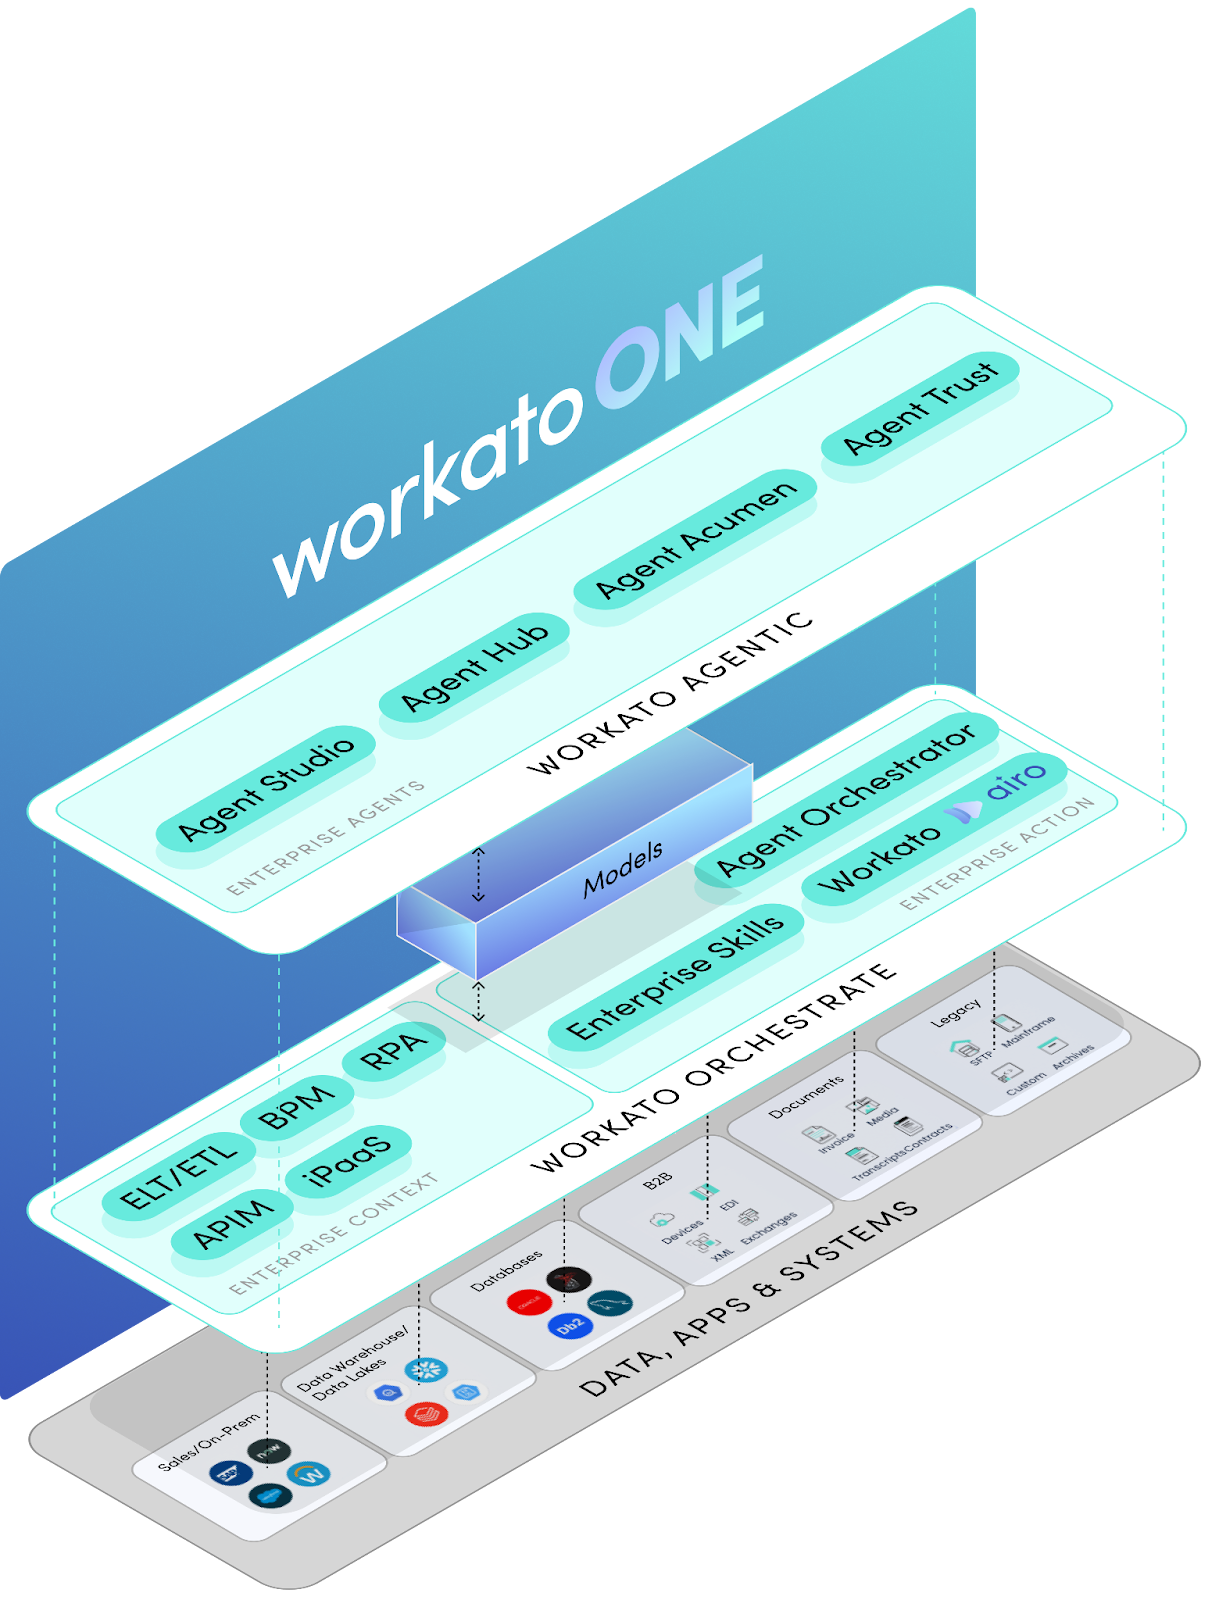
How Workato helps: Real-time, connected insights
Many companies struggle not with BI or analytics themselves but with fragmented data. Disconnected systems like CRM, core banking software, and fraud detection platforms make it hard to get a unified view of all organizational data.
That’s where Workato can be a game-changer.
Workato offers universal connectivity and real-time data to help modern financial services companies understand their operations on a deeper level. Workato connects data across core banking systems, KYC tools, CRM systems, and fraud platforms — creating a unified, real-time view that streamlines operations and reduces risk exposure.
For financial services organizations, Workato delivers key benefits:
- Connect disparate systems quickly so your BI and analytics tools have consistent, up-to-date data.
- Trigger automated workflows when analytics models detect high-risk patterns or actionable opportunities.
- Reduce manual handoffs between teams by embedding insights directly into operational processes.
Learn more: Workato for Financial Services
Final thoughts: Unify your data and accelerate insights with Workato!
Business intelligence and business analytics are unique yet complementary. BI provides a retrospective and operational view of performance, answering the question: “What happened?”. Analytics goes further by figuring out why things happened and what actions should be taken to optimize future outcomes.
For financial services teams where timing, compliance, and risk matter, the combination of universal connectivity and real-time data is not optional. It’s a competitive necessity.
Workato offers universal connectivity and real-time data, connecting core banking systems, KYC tools, CRM, and fraud platforms. This integration provides a unified, actionable view of operations while streamlining workflows, reducing risk exposure, and enabling confident decision-making.
Ready to unify your data and accelerate insights? Find out why today’s leading financial services firms rely on Workato.
This post was written by Bravin Wasike. Bravin is currently a freelance Machine Learning and DevOps engineer. He is passionate about machine learning and deploying models to production using Docker and Kubernetes.