
Change is the only constant
Whether it be life, or work – change is inevitable. It is no different when it comes automations for your business processes powered by Workato recipes. Sales and marketing operations teams are constantly looking for ways to enrich the data quality for leads, improving the response times, and conversion by optimizing the qualification & routing rules. HR and IT teams are iterating on processes to create world class employee experiences; finance and accounting teams are finding efficient ways to shorten the month end closing, and such continuous evolution is natural for all business processes.
Consequently, teams building automations using Workato recipes are also going to be busy managing changes as business processes evolve.
Adapting to changes faster with Dependency Graph
As the number of your automations and the size of your team building automations increase, there’s also a dramatic increase in the interdependency between recipes, connections, lookup tables, and other assets. Even the smallest changes to a connection, callable recipe, manifest, or lookup table can have a big impact on your projects. Understanding and analyzing these dependencies becomes critical for managing changes and the lifecycle of your automations.
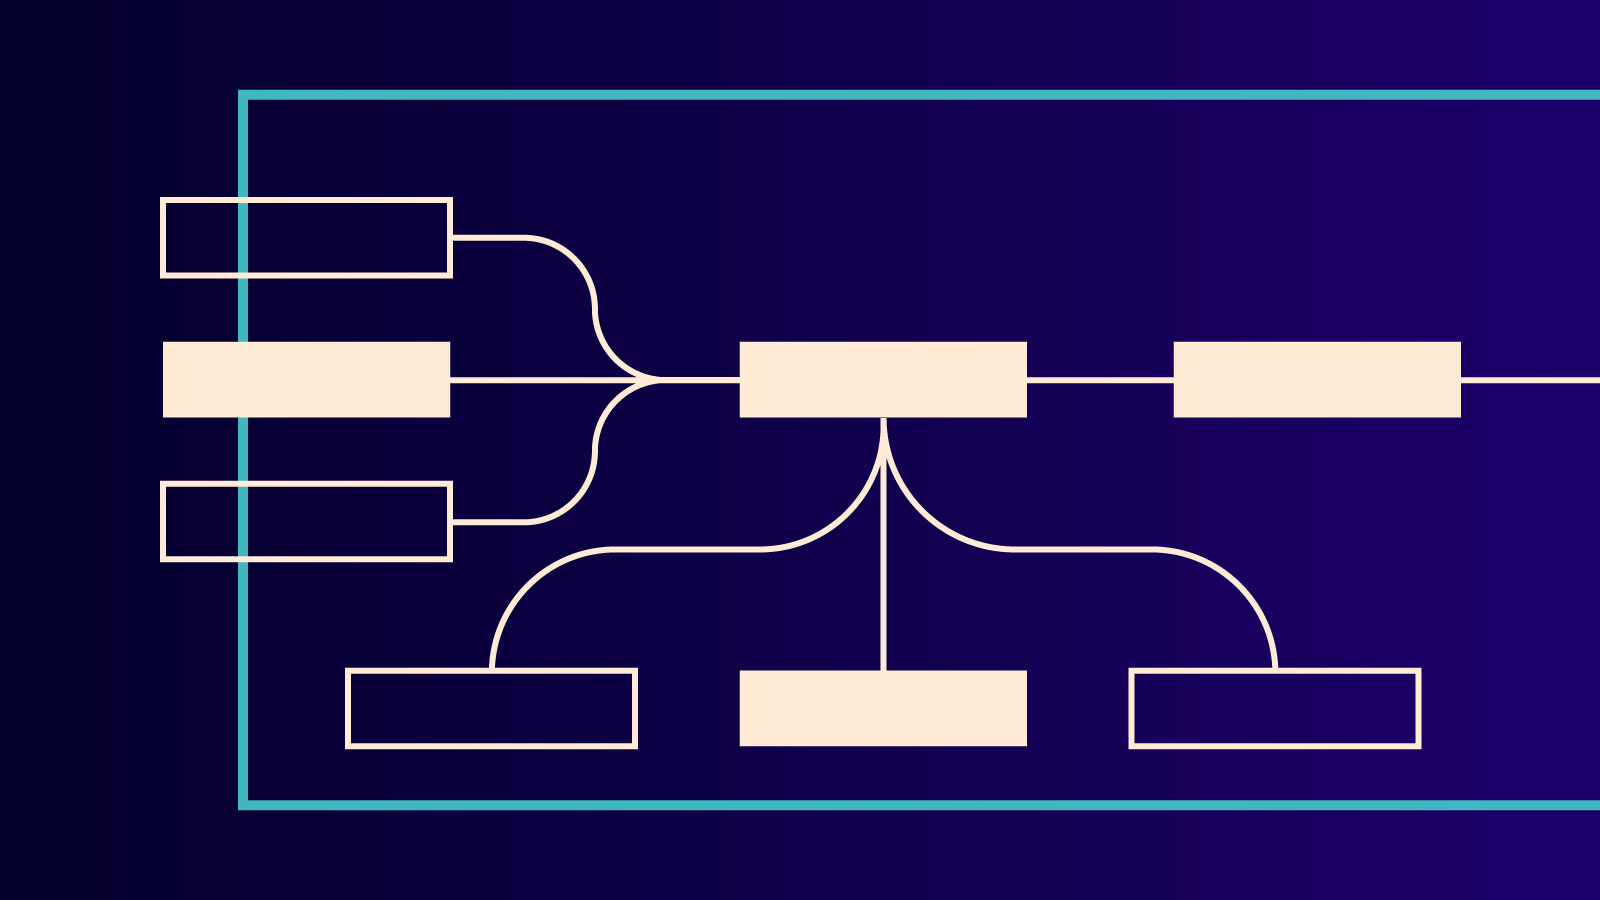
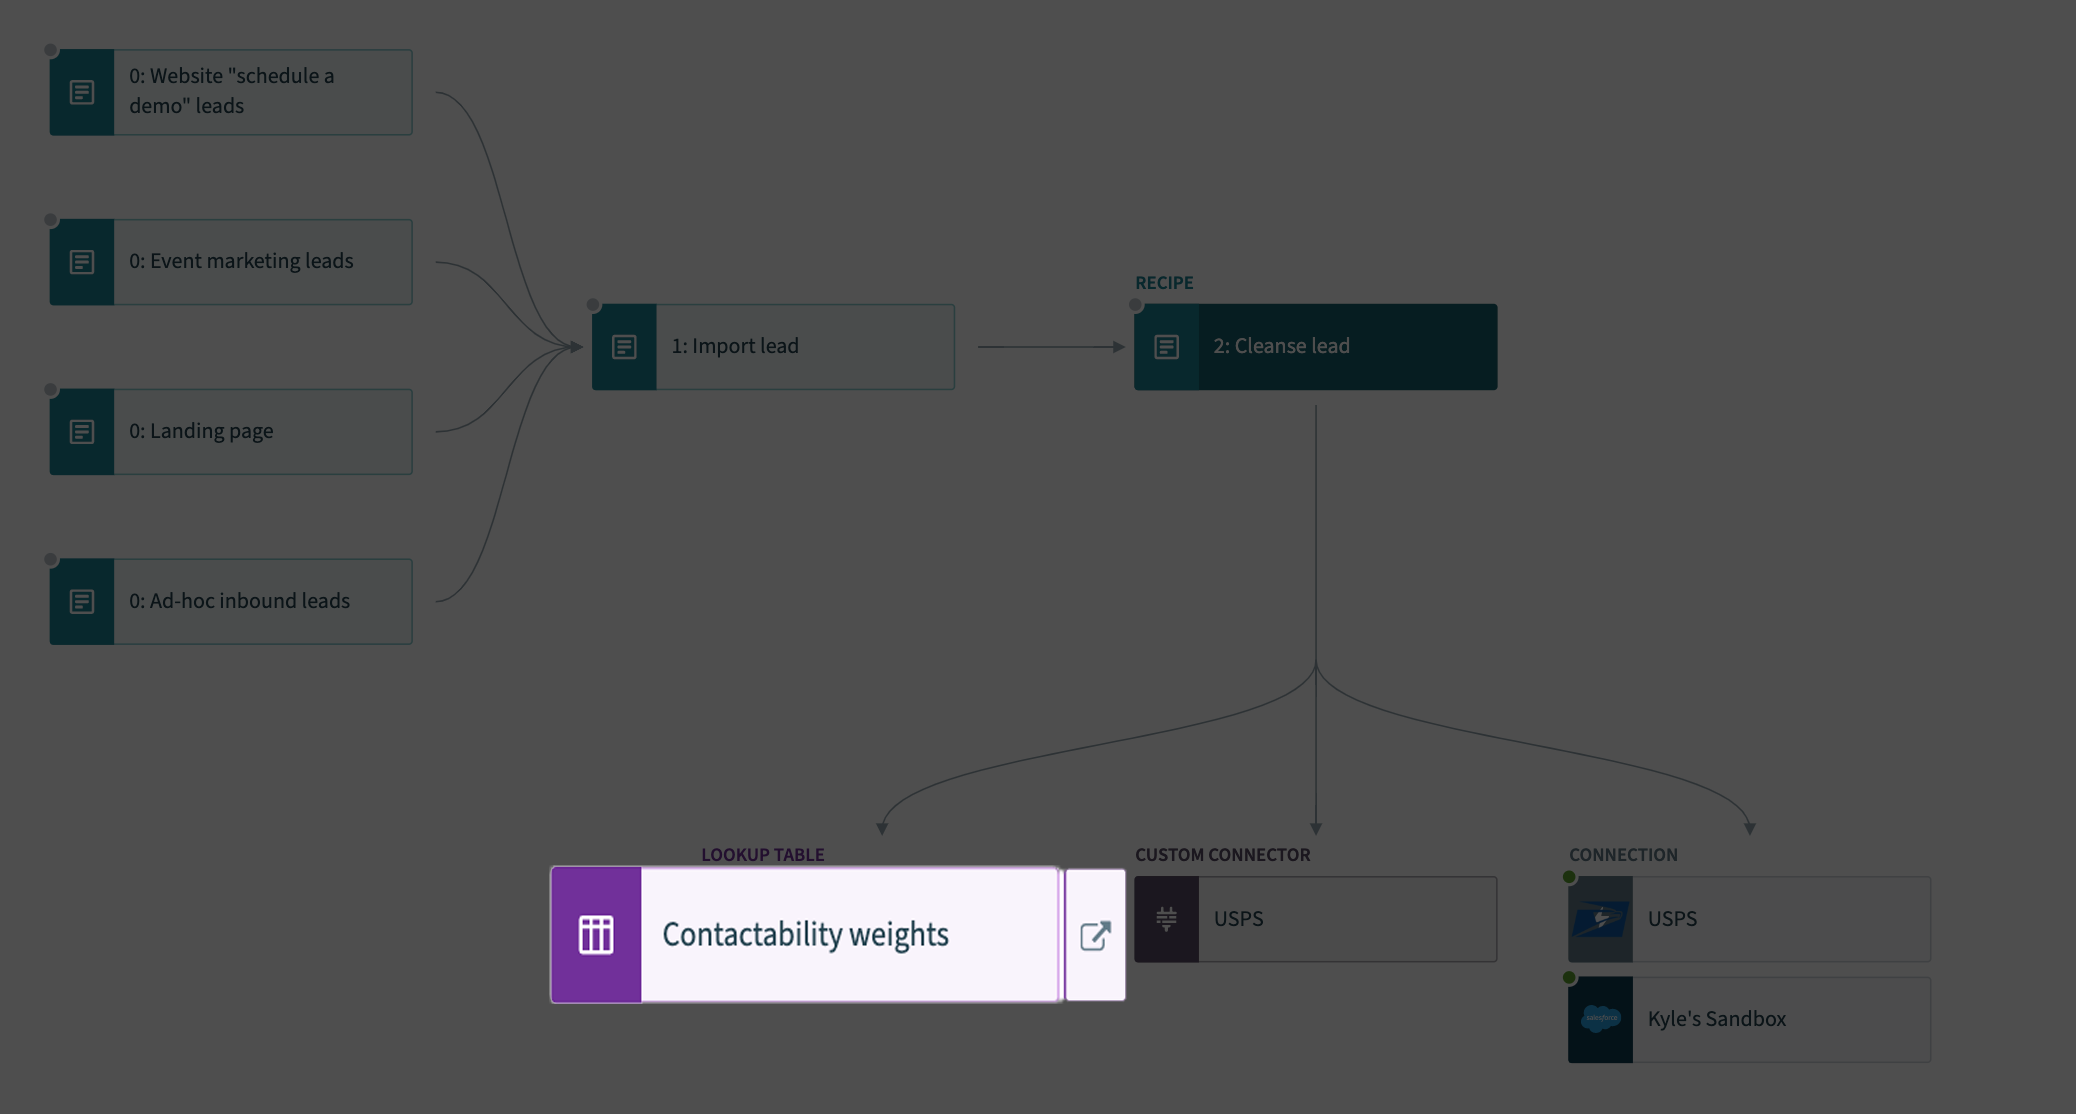
Workato’s Dependency Graph visually illustrates the relationships between every asset and resource in your account. Easily navigate and inspect dependencies, and identify and assess how a change in one asset might affect others.
Interface illustration of the relationship between asset and resource
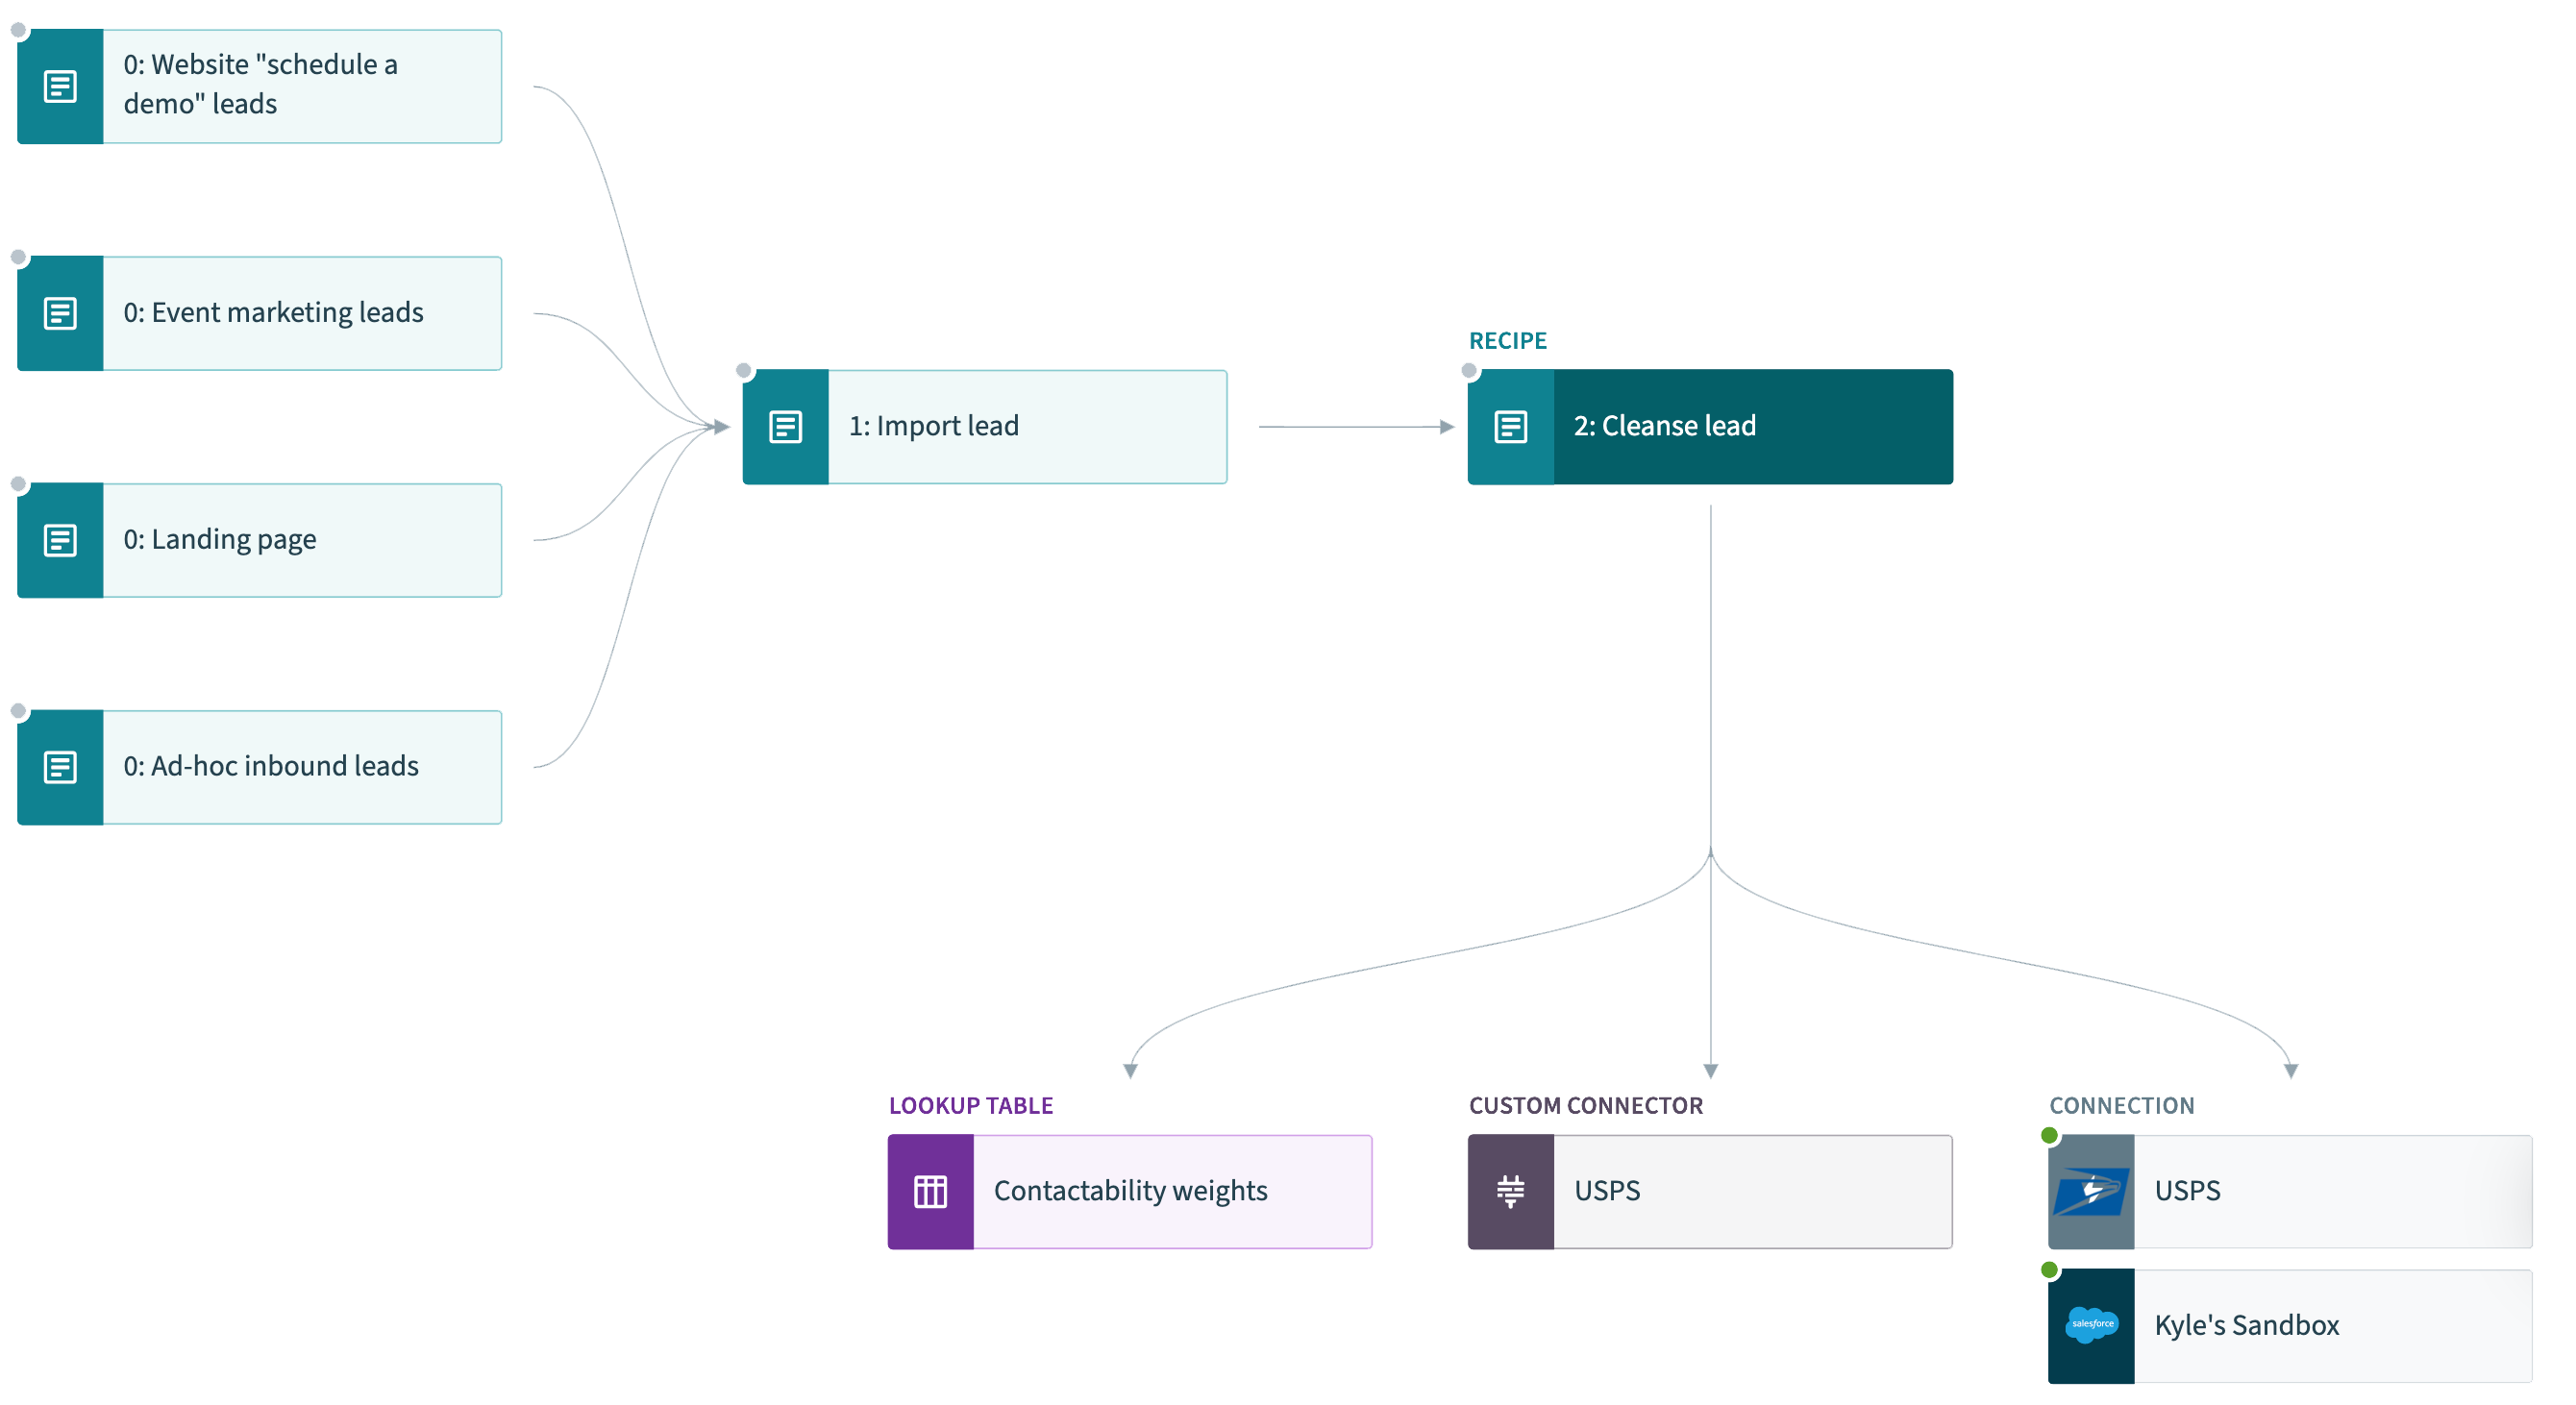
Find dependencies in both directions
When you view dependencies for an object, the graph displays upstream and downstream dependencies. The object depends on its upstream dependencies and is itself a dependency for assets downstream.
Audit your access policies
Let’s say you want to verify that a sensitive Salesforce connection is being used by the right collaborators. You can find the Dependency Graph under the Workato Dashboard. Choose the relevant connections, and Workato will help you find out who’s using them, and where you might need to strengthen your Workato access policies.
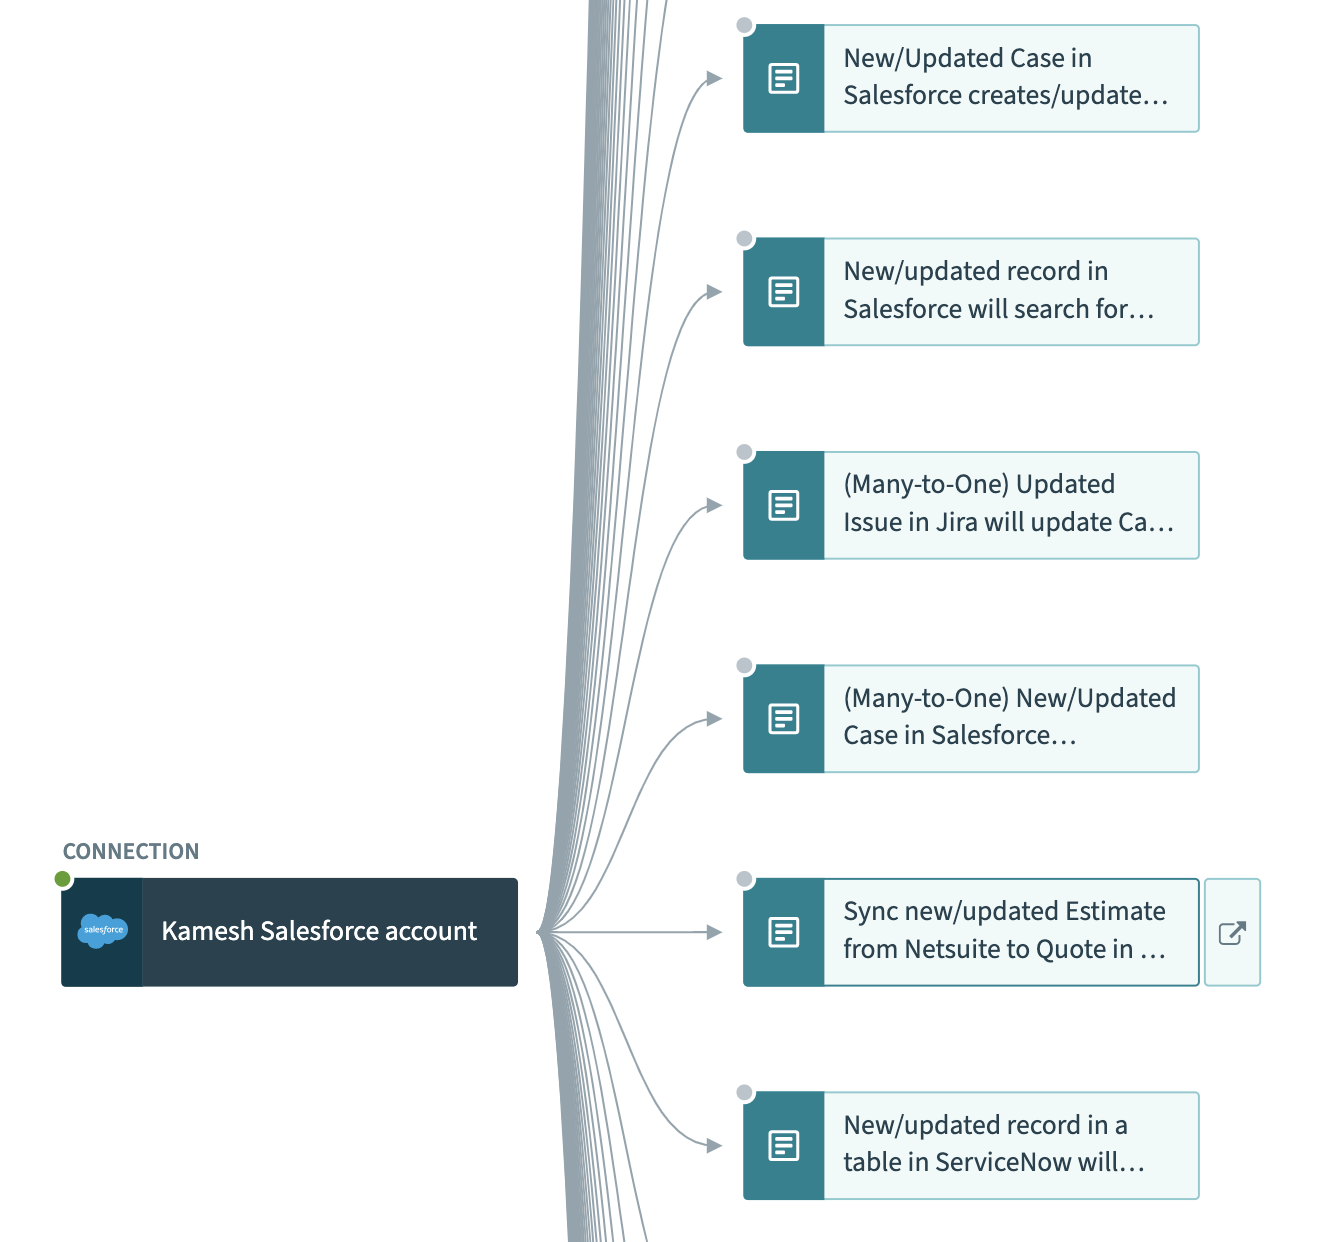
Choosing the relevant connections, find out who’s using them, and where to strengthen access policies.
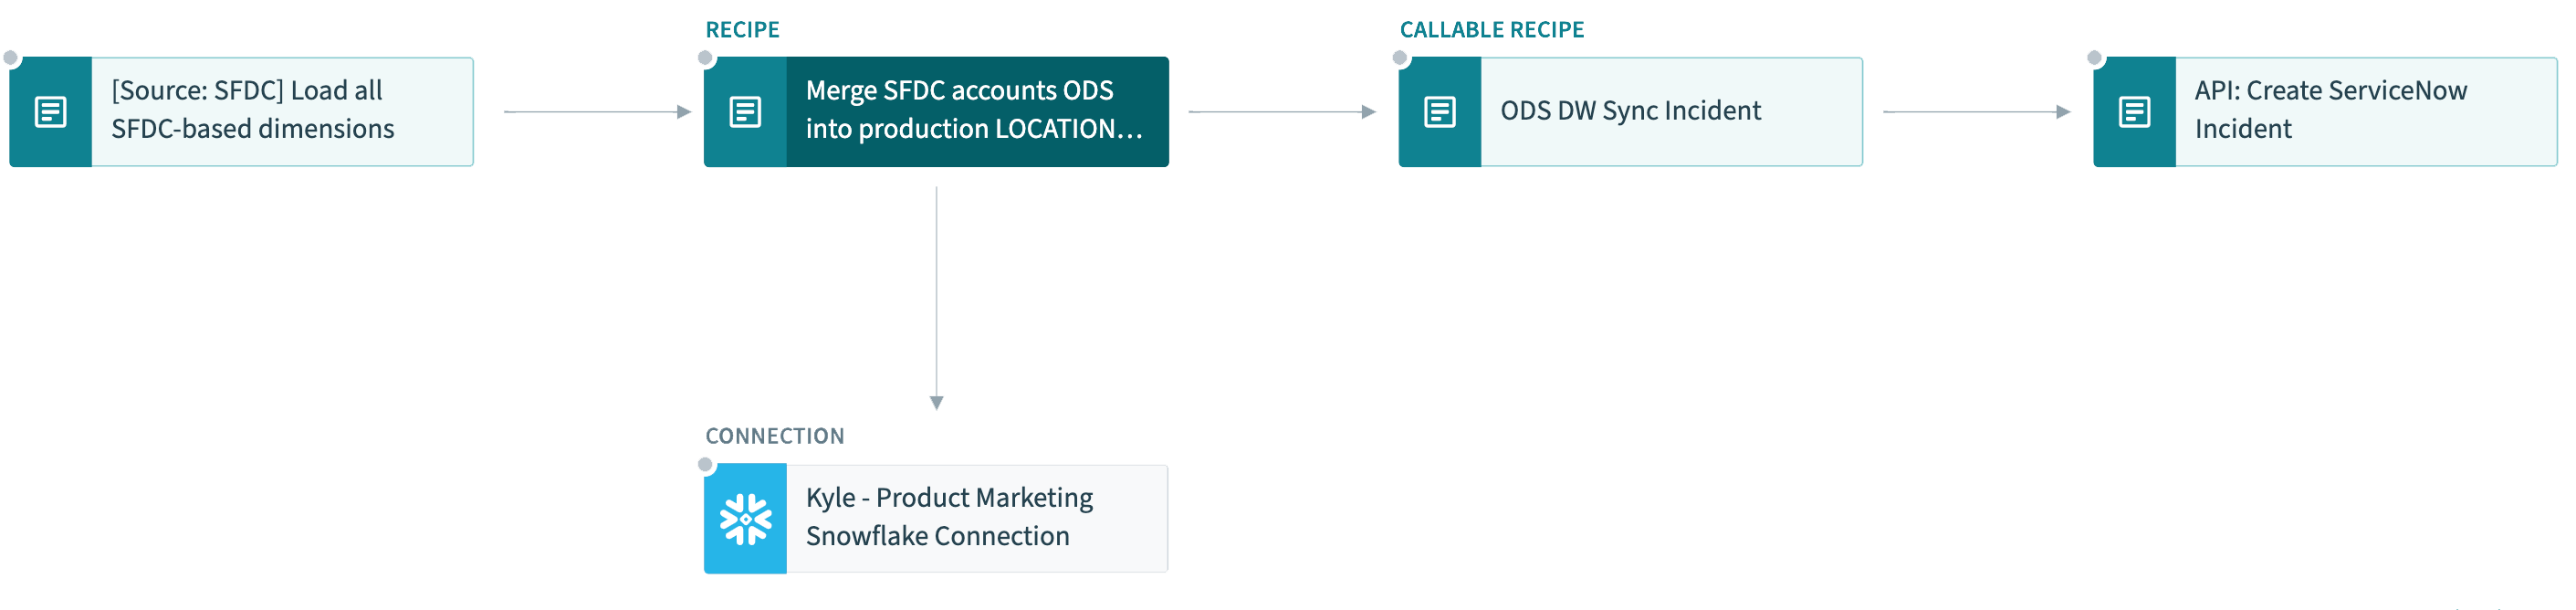
Assess impact before making changes
What if you’re making changes to a callable recipe’s interface? How do you know who might be affected, or what other recipes you might need to update? Navigate to it in the Dependency Graph, or get to the graph from the recipe’s settings.
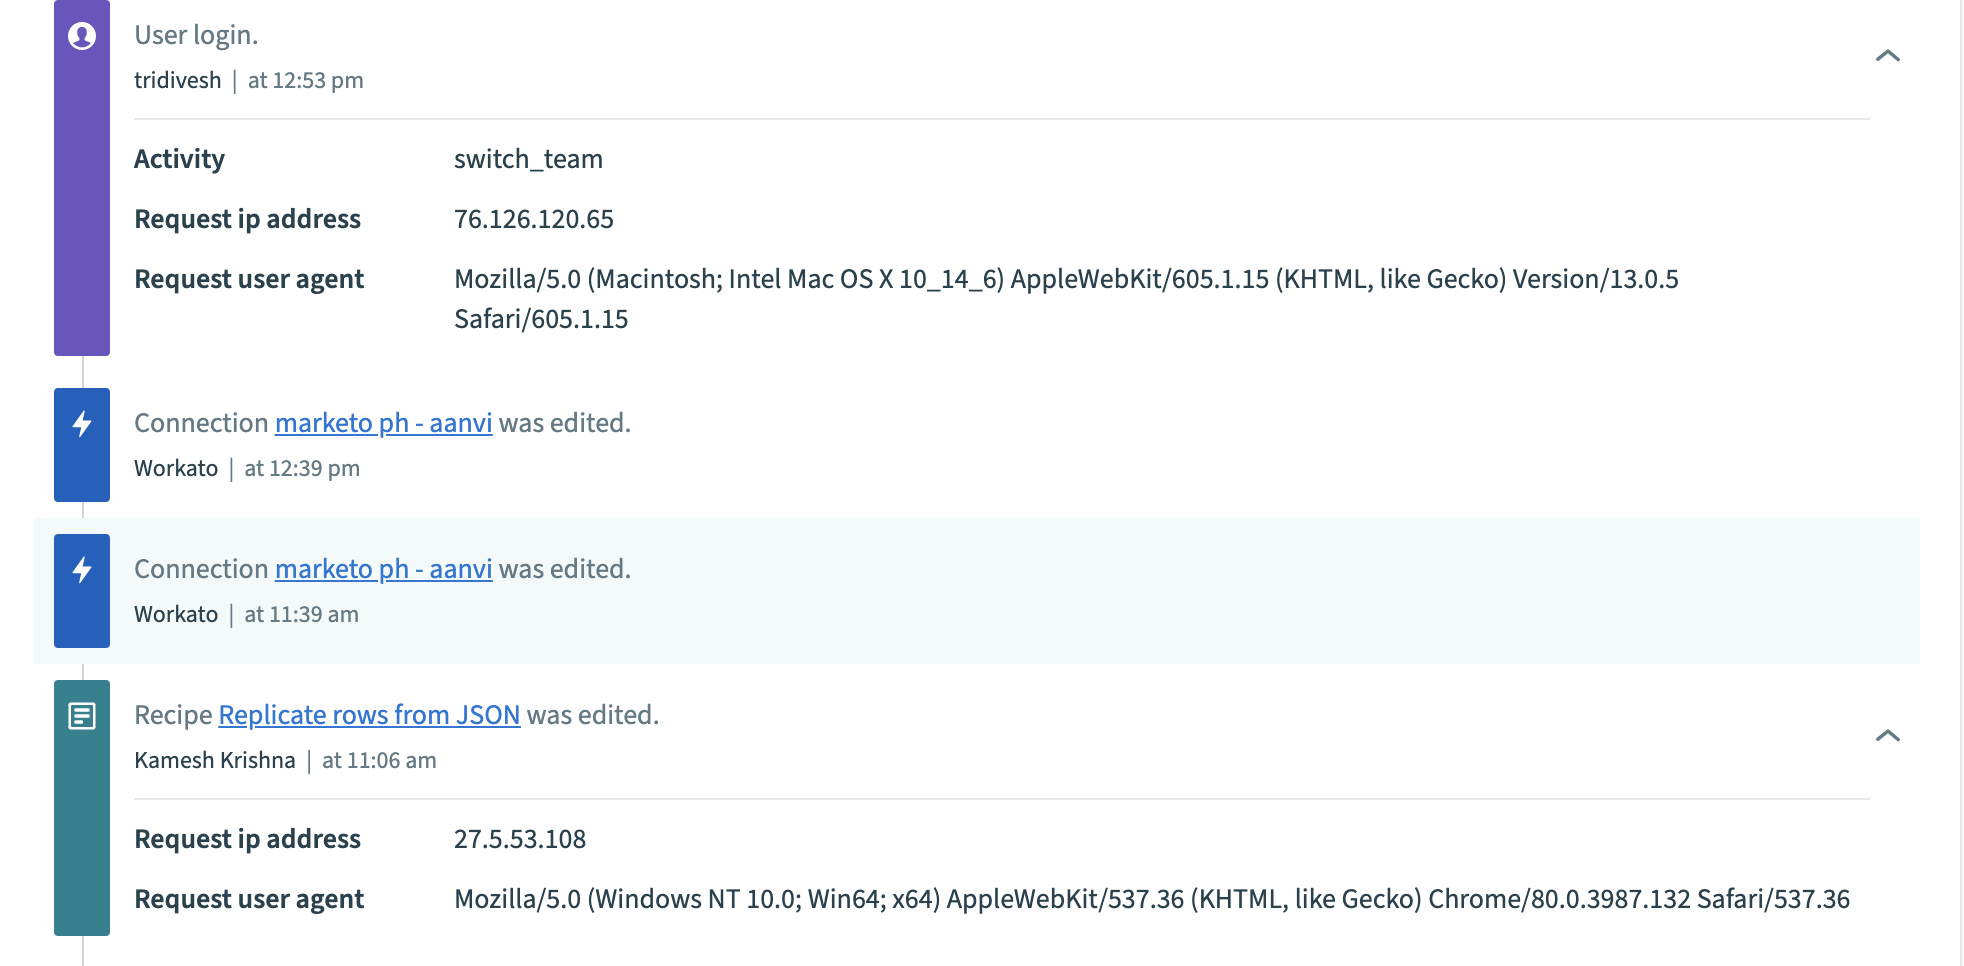
Track, and audit change activity
Workato will identify the dependant recipes, applications, and other assets that might be impacted. Click to learn more about each asset, and enrich your understanding of a project’s dependencies and ownership with the activity audit log.
Workato’s dependency graph allows you to have the confidence that your projects are under your control.
To learn more, just request a demo to get started.